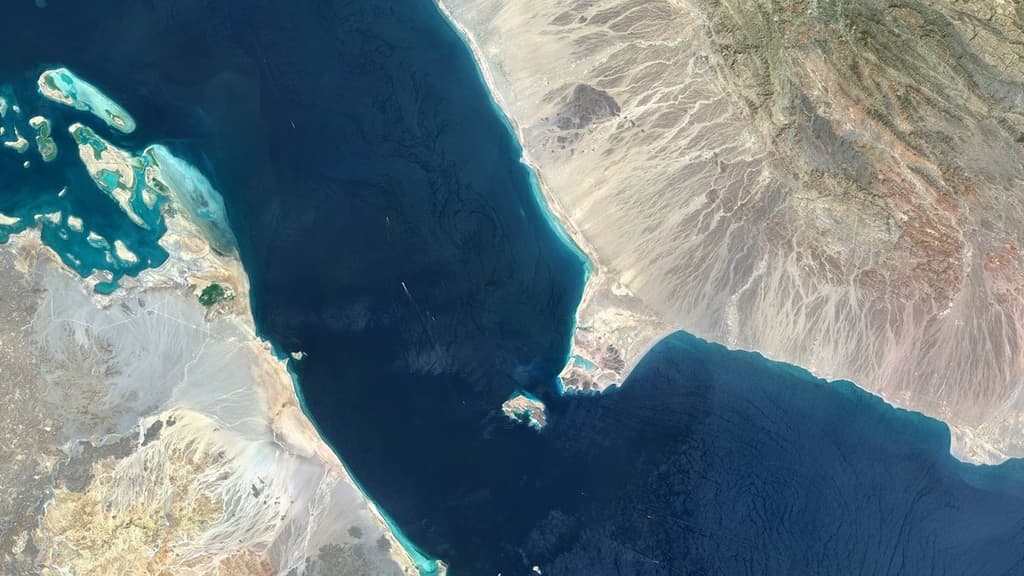
Recent data show Bab el-Mandeb daily transits fluctuating in the low-to-mid 30s, with 36 confirmed crossings on August 25 and a weekly average near 269 vessels amid subdued commodity flows. Persistent Houthi threats, including the August 11 fatal strike and August 18 attack, sustain elevated war-risk premiums (0.20–1% hull, $50–100/TEU cargo) that raise effective transport costs and prompt selective rerouting or Cape diversions by carriers. Partial Suez recovery, driven mainly by container lines testing the shorter Asia-Europe route, supports volumes near the 30–34 band, while tanker activity remains constrained by sanctions, shadow-fleet shifts, and ballast-heavy movements. The tight 37.5%/37.0% split between the leading ranges reflects trader focus on near-term security incidents and insurance dynamics that could push daily averages lower or sustain modest gains through month-end.
Experimental AI-generated summary referencing Polymarket data. This is not trading advice and plays no role in how this market resolves. · UpdatedAvg. # of ships transiting Bab el-Mandeb Strait end of August?
Avg. # of ships transiting Bab el-Mandeb Strait end of August?
25-29 38%
30-34 37%
35-39 12%
<25 11.1%
$28,571 Vol.
$28,571 Vol.
<25
11%
25-29
38%
30-34
37%
35-39
12%
40+
3%
25-29 38%
30-34 37%
35-39 12%
<25 11.1%
$28,571 Vol.
$28,571 Vol.
<25
11%
25-29
38%
30-34
37%
35-39
12%
40+
3%
Transit calls include container, dry bulk, roll-on/roll-off, general cargo, and tanker ships. Ships not reported by IMF Portwatch will not be considered.
This market will resolve as soon as the relevant data has been published. If the relevant data is not published within 14 calendar days of the specified date, this market will resolve based on the most recent data published up to that point.
In case of obvious data integrity issues (i.e., erroneous data), the market may remain open until the end of the third calendar day (ET) after the date on which such data is first released to allow for corrections. Data integrity issues refer only to clerical or other similar errors in the underlying data, and do not include cases where IMF Portwatch differs from alternative sources.
The resolution source for this market will be IMF PortWatch, specifically the “Arrivals of Ships” data published for the Bab el-Mandeb Strait at https://portwatch.imf.org/pages/6b1814d64903461b98144a6cc25eb79c.
Market Opened: Jul 31, 2026, 2:13 PM ET
Resolution Source
IMF PortWatchResolver
0x69c47De9D...Transit calls include container, dry bulk, roll-on/roll-off, general cargo, and tanker ships. Ships not reported by IMF Portwatch will not be considered.
This market will resolve as soon as the relevant data has been published. If the relevant data is not published within 14 calendar days of the specified date, this market will resolve based on the most recent data published up to that point.
In case of obvious data integrity issues (i.e., erroneous data), the market may remain open until the end of the third calendar day (ET) after the date on which such data is first released to allow for corrections. Data integrity issues refer only to clerical or other similar errors in the underlying data, and do not include cases where IMF Portwatch differs from alternative sources.
The resolution source for this market will be IMF PortWatch, specifically the “Arrivals of Ships” data published for the Bab el-Mandeb Strait at https://portwatch.imf.org/pages/6b1814d64903461b98144a6cc25eb79c.
Resolution Source
IMF PortWatchResolver
0x69c47De9D...Recent data show Bab el-Mandeb daily transits fluctuating in the low-to-mid 30s, with 36 confirmed crossings on August 25 and a weekly average near 269 vessels amid subdued commodity flows. Persistent Houthi threats, including the August 11 fatal strike and August 18 attack, sustain elevated war-risk premiums (0.20–1% hull, $50–100/TEU cargo) that raise effective transport costs and prompt selective rerouting or Cape diversions by carriers. Partial Suez recovery, driven mainly by container lines testing the shorter Asia-Europe route, supports volumes near the 30–34 band, while tanker activity remains constrained by sanctions, shadow-fleet shifts, and ballast-heavy movements. The tight 37.5%/37.0% split between the leading ranges reflects trader focus on near-term security incidents and insurance dynamics that could push daily averages lower or sustain modest gains through month-end.
Experimental AI-generated summary referencing Polymarket data. This is not trading advice and plays no role in how this market resolves. · Updated
Beware of external links.
Beware of external links.
Frequently Asked Questions