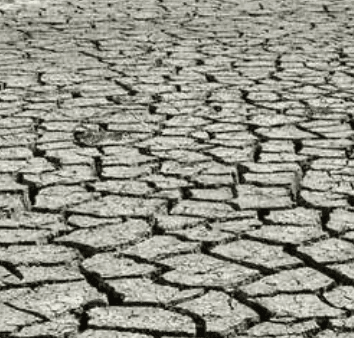
The U.S. Drought Monitor map with data valid August 25, 2026, shows exceptional (D4) conditions concentrated in limited portions of western Nebraska, Colorado, northeastern Oregon, southern Idaho, and small areas of Utah and southern California deserts, representing roughly 1.5% of the contiguous United States. These pockets reflect ongoing multi-month precipitation deficits, elevated evaporative demand under persistent heat, and flash drought intensification across the Southern Plains and Lower Mississippi Basin, where recent weeks brought rapid degradation in soil moisture and streamflows. Monsoon activity provided localized relief in parts of the Southwest, while scattered improvements occurred farther east. The weekly classification integrates precipitation, temperature, soil moisture percentiles, and groundwater data from NOAA, USDA, and NASA sources, with the next update scheduled for early September.
Experimental AI-generated summary referencing Polymarket data. This is not trading advice and plays no role in how this market resolves. · UpdatedExceptional drought (D4) by state — week of August 25, 2026
Exceptional drought (D4) by state — week of August 25, 2026
$3,840 Vol.
Alabama
1%
Arkansas
99%
California
1%
Delaware
1%
Florida
1%
Georgia
1%
Idaho
100%
Indiana
1%
Kansas
1%
Kentucky
1%
Louisiana
1%
Maryland
1%
Minnesota
1%
Mississippi
99%
Nevada
99%
New Jersey
1%
New Mexico
99%
North Carolina
99%
North Dakota
1%
Oklahoma
100%
Oregon
100%
Pennsylvania
1%
South Carolina
1%
South Dakota
1%
Texas
99%
Utah
99%
Virginia
49%
Washington
1%
West Virginia
1%
Wisconsin
2%
Wyoming
1%
$3,840 Vol.
Alabama
1%
Arkansas
99%
California
1%
Delaware
1%
Florida
1%
Georgia
1%
Idaho
100%
Indiana
1%
Kansas
1%
Kentucky
1%
Louisiana
1%
Maryland
1%
Minnesota
1%
Mississippi
99%
Nevada
99%
New Jersey
1%
New Mexico
99%
North Carolina
99%
North Dakota
1%
Oklahoma
100%
Oregon
100%
Pennsylvania
1%
South Carolina
1%
South Dakota
1%
Texas
99%
Utah
99%
Virginia
49%
Washington
1%
West Virginia
1%
Wisconsin
2%
Wyoming
1%
D4 area below 0.05% is treated as cartographic noise at state borders and resolves "No".
Alabama carries a market in May through November, so this market exists for the week valid August 25, 2026. Weeks outside that window have no Alabama market and make no claim about Alabama's drought.
Each USDM release covers the seven-day period ending Tuesday at 8:00 AM ET and is published the following Thursday.
Resolution is based on the first published US Drought Monitor release for the listed week. Subsequent revisions will not be considered; the first published release is final.
The resolution source for this market is the US Drought Monitor at droughtmonitor.unl.edu.
Market Opened: Aug 20, 2026, 9:00 AM ET
Resolution Source
https://droughtmonitor.unl.edu/DmData/DataTables.aspxResolver
0x65070BE91...D4 area below 0.05% is treated as cartographic noise at state borders and resolves "No".
Alabama carries a market in May through November, so this market exists for the week valid August 25, 2026. Weeks outside that window have no Alabama market and make no claim about Alabama's drought.
Each USDM release covers the seven-day period ending Tuesday at 8:00 AM ET and is published the following Thursday.
Resolution is based on the first published US Drought Monitor release for the listed week. Subsequent revisions will not be considered; the first published release is final.
The resolution source for this market is the US Drought Monitor at droughtmonitor.unl.edu.
Resolution Source
https://droughtmonitor.unl.edu/DmData/DataTables.aspxResolver
0x65070BE91...The U.S. Drought Monitor map with data valid August 25, 2026, shows exceptional (D4) conditions concentrated in limited portions of western Nebraska, Colorado, northeastern Oregon, southern Idaho, and small areas of Utah and southern California deserts, representing roughly 1.5% of the contiguous United States. These pockets reflect ongoing multi-month precipitation deficits, elevated evaporative demand under persistent heat, and flash drought intensification across the Southern Plains and Lower Mississippi Basin, where recent weeks brought rapid degradation in soil moisture and streamflows. Monsoon activity provided localized relief in parts of the Southwest, while scattered improvements occurred farther east. The weekly classification integrates precipitation, temperature, soil moisture percentiles, and groundwater data from NOAA, USDA, and NASA sources, with the next update scheduled for early September.
Experimental AI-generated summary referencing Polymarket data. This is not trading advice and plays no role in how this market resolves. · Updated
Beware of external links.
Beware of external links.
Frequently Asked Questions