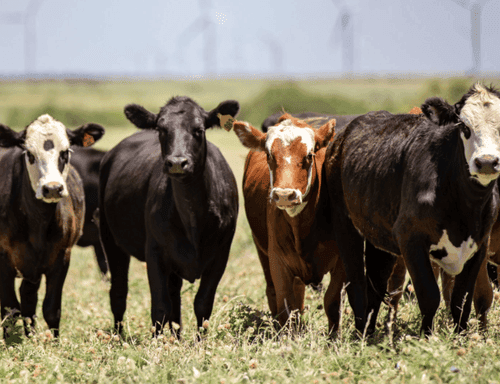
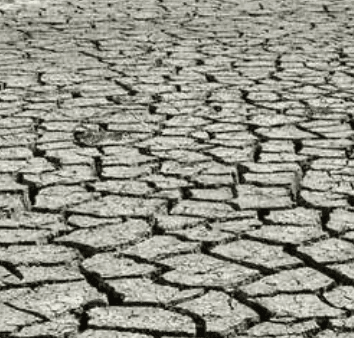
**Recent U.S. Drought Monitor data (valid August 25, 2026) show 58% of cattle inventory area in drought (D1–D4), placing the metric squarely between the two leading market outcomes.** This figure derives from the weekly U.S. Drought Monitor (USDM) overlay on cattle distribution from NASS data, with key cattle states (Texas, Kansas, Oklahoma, Nebraska, Colorado) contributing the majority of the affected acreage. Drought has expanded rapidly in the Southern and High Plains, where excessive heat (weekly highs often exceeding 100–110°F) and below-normal rainfall have degraded pastures and stock water supplies. Monsoon activity has delivered only localized relief in the Southwest, while the Intermountain West and parts of the northern Plains continue to see degradation. Pasture and range conditions sit at just 21% good-to-excellent nationally, down sharply year-over-year, prompting early culling and supplemental feeding in drought-stressed regions. The near-even split between “60% or more” (53.5%) and “50–59%” (46.5%) reflects uncertainty over whether the next USDM update (covering conditions through early September) will register further expansion or modest stabilization ahead of fall. Short-term forecasts favor continued dryness across much of the southern cattle belt, but scattered precipitation or model shifts could keep the reading below the 60% threshold. The negligible odds on lower brackets underscore the entrenched multi-week drought footprint in primary inventory areas.
Experimental AI-generated summary referencing Polymarket data. This is not trading advice and plays no role in how this market resolves. · UpdatedWhat percent of U.S. cattle inventory area will be in drought? (week of September 1)
What percent of U.S. cattle inventory area will be in drought? (week of September 1)
60% or more 54%
50% to 59% 47%
Under 40% <1%
40% to 49% <1%
Under 40%
<1%
40% to 49%
<1%
50% to 59%
47%
60% or more
54%
60% or more 54%
50% to 59% 47%
Under 40% <1%
40% to 49% <1%
Under 40%
<1%
40% to 49%
<1%
50% to 59%
47%
60% or more
54%
This market will resolve to the bracket containing the reported percentage for the U.S. Drought Monitor week of September 1, 2026. Each U.S. Drought Monitor release covers the seven-day period ending Tuesday at 8:00 AM ET and is published the following Thursday. The first value published for that week is final and will resolve this market independently of any later revisions or corrections.
If the source reports a value with decimals, it is rounded to the nearest whole number (a value of exactly 0.5 rounds up) before the bracket is selected. The brackets are inclusive of their stated endpoints and do not overlap.
If no value for the week of September 1, 2026 is published by September 10, 2026, 11:59 PM ET, this market will resolve based on the most recently published "D1-D4" value for cattle inventory with an effective date on or before September 1, 2026.
Market Opened: Aug 25, 2026, 5:16 PM ET
Resolution Source
https://agindrought.unl.edu/Table.aspx?2Resolver
0x69c47De9D...This market will resolve to the bracket containing the reported percentage for the U.S. Drought Monitor week of September 1, 2026. Each U.S. Drought Monitor release covers the seven-day period ending Tuesday at 8:00 AM ET and is published the following Thursday. The first value published for that week is final and will resolve this market independently of any later revisions or corrections.
If the source reports a value with decimals, it is rounded to the nearest whole number (a value of exactly 0.5 rounds up) before the bracket is selected. The brackets are inclusive of their stated endpoints and do not overlap.
If no value for the week of September 1, 2026 is published by September 10, 2026, 11:59 PM ET, this market will resolve based on the most recently published "D1-D4" value for cattle inventory with an effective date on or before September 1, 2026.
Resolution Source
https://agindrought.unl.edu/Table.aspx?2Resolver
0x69c47De9D...**Recent U.S. Drought Monitor data (valid August 25, 2026) show 58% of cattle inventory area in drought (D1–D4), placing the metric squarely between the two leading market outcomes.** This figure derives from the weekly U.S. Drought Monitor (USDM) overlay on cattle distribution from NASS data, with key cattle states (Texas, Kansas, Oklahoma, Nebraska, Colorado) contributing the majority of the affected acreage. Drought has expanded rapidly in the Southern and High Plains, where excessive heat (weekly highs often exceeding 100–110°F) and below-normal rainfall have degraded pastures and stock water supplies. Monsoon activity has delivered only localized relief in the Southwest, while the Intermountain West and parts of the northern Plains continue to see degradation. Pasture and range conditions sit at just 21% good-to-excellent nationally, down sharply year-over-year, prompting early culling and supplemental feeding in drought-stressed regions. The near-even split between “60% or more” (53.5%) and “50–59%” (46.5%) reflects uncertainty over whether the next USDM update (covering conditions through early September) will register further expansion or modest stabilization ahead of fall. Short-term forecasts favor continued dryness across much of the southern cattle belt, but scattered precipitation or model shifts could keep the reading below the 60% threshold. The negligible odds on lower brackets underscore the entrenched multi-week drought footprint in primary inventory areas.
Experimental AI-generated summary referencing Polymarket data. This is not trading advice and plays no role in how this market resolves. · Updated
Beware of external links.
Beware of external links.
Frequently Asked Questions